Round Robin is the CPU scheduling algorithm exam questions love, because the answer is easy to get wrong in one specific place: the order of the ready queue. This guide solves a full example the way marks are awarded, slice by slice with the queue written out, then builds the Gantt chart and the turnaround, waiting and response times from it. A practice question with its answer is at the end.
How Round Robin works
Every process gets the CPU for at most one time quantum at a time.
- The process at the front of the ready queue runs for one quantum, or less if it finishes sooner.
- If it finishes, it leaves. If not, it goes to the back of the queue.
- Processes that arrive during that slice, or exactly when it ends, join the queue before the process that was just preempted. This is the usual textbook convention, and the rule most wrong answers break.
- If the queue is empty, the CPU sits idle until the next process arrives.
Because nobody holds the CPU for more than one quantum, every process starts quickly. That is why time-sharing and interactive systems use it.
Worked example
Four processes, time quantum 2:
| Process | Arrival time | Burst time |
|---|---|---|
| P1 | 0 | 5 |
| P2 | 1 | 3 |
| P3 | 2 | 1 |
| P4 | 3 | 2 |
Step 1: The ready queue, slice by slice
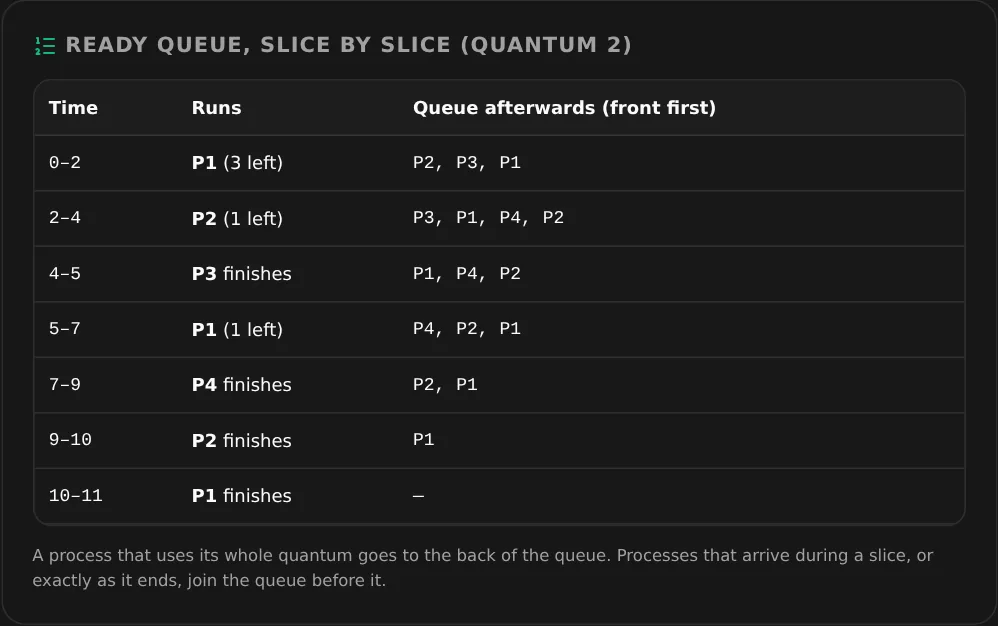
The ready queue after every slice, from the CPU scheduling calculator.
Walk through the first two rows, because they decide everything after:
- 0–2: P1 is alone at time 0, so it runs. During the slice P2 arrives (time 1), and P3 arrives exactly at 2, as the slice ends. Both join the queue before P1 goes back, so the queue is P2, P3, P1, not P2, P1, P3.
- 2–4: P2 runs, with 1 unit left. P4 arrives at 3 and joins first, then P2 goes to the back: P3, P1, P4, P2.
- 4–5: P3 needs only 1 unit, so it finishes early and the next slice starts at once, at time 5.
The rest follows the same two rules until the queue is empty at time 11.
Step 2: The Gantt chart
Read the "Runs" column straight across:
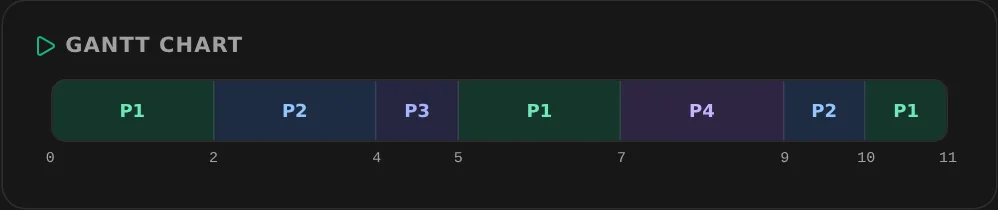
P1 runs three times, in slices of 2, 2 and 1. P3's slice is short because it only needed 1 unit.
Step 3: The times
From the Gantt chart, each process's completion time (CT) is the end of its last slice. Then:
- Turnaround time TAT = CT − arrival time
- Waiting time WT = TAT − burst time
- Response time RT = first time on the CPU − arrival time
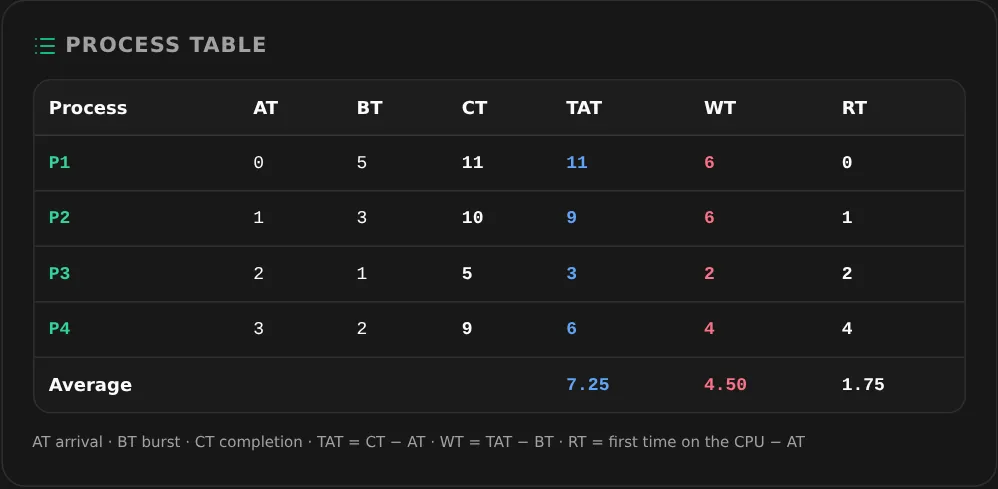
Average turnaround 7.25, average waiting 4.50, average response 1.75.
How it compares with FCFS
On the same four processes, first-come-first-served gives an average turnaround of 6.75 and an average waiting time of 4, both slightly better, because P1 simply runs to the end. But FCFS's average response time is 4, against Round Robin's 1.75. That is the trade-off in one example: Round Robin answers everyone sooner, at the cost of finishing the long job later and spending time on context switches.
Choosing the time quantum
Exam questions give you the quantum; real systems have to choose it.
- Too large, and Round Robin turns into FCFS: every process finishes inside its first slice.
- Too small, and the CPU spends much of its time switching between processes instead of running them.
- A common rule of thumb is to pick a quantum that about 80% of CPU bursts finish within.
Try the same processes with quantum 1, 2 and 5 in the CPU scheduling calculator and watch the averages move. Its Compare all algorithms view puts FCFS, SJF, SRTF, Priority and Round Robin side by side.
Common mistakes
- Putting the preempted process back before new arrivals. Arrivals during the slice (or at its end) go first.
- Giving a process a full quantum it does not need. A process with 1 unit left runs for 1 unit, and the next slice starts immediately.
- Forgetting idle time. If nothing is ready, the CPU waits for the next arrival, and the Gantt chart shows a gap.
- Measuring waiting time from 0 instead of from the arrival time.
- Confusing response time with waiting time. Response time counts only until the first slice; waiting time counts every moment spent in the queue.
Practice question
Five processes arrive at 0, 1, 2, 3 and 4 with burst times 8, 2, 7, 3 and 5. Schedule them with Round Robin, quantum 3, and find the average turnaround and waiting times.
Answer. The Gantt chart is P1 (0–3), P2 (3–5), P3 (5–8), P4 (8–11), P1 (11–14), P5 (14–17), P3 (17–20), P1 (20–22), P5 (22–24), P3 (24–25). Completion times are P1 22, P2 5, P3 25, P4 11, P5 24, so the average turnaround time is 15.4 and the average waiting time is 10.4. Check each step, including the queue, by entering the lists into the calculator.
Once scheduling makes sense, the same operating-systems toolkit covers page replacement (FIFO, LRU and Optimal) and deadlock avoidance with the banker's algorithm.
For a related walkthrough, read Banker's Algorithm Example, Step by Step.